
Targeting early amyloid and tau deposition and propagation
Background
The two pathological hallmarks of Alzheimer’s disease (AD) are plaques, and tangles. The plaques are little clumps of the amyloid-beta protein (Aβ) and the tangles are twisted strands of the tau protein.
These proteins are hypothesized to be the earliest indicators of AD as they can often be found decades before any noticeable cognitive changes have occurred in an Alzheimer’s patient.
Due to recent PET scan technology, the presence of Aβ and tau proteins can now be measured in-vivo.
Ongoing Research
In collaboration with the StoP-AD Centre we are currently conducting a multimodal longitudinal research project that assesses the presence of Aβ and tau deposits in-vivo. This project focuses on cognitively normal individuals with a family history of AD.
Specific research projects in the lab related to these data include:
- Improving the PET and CSF cutoffs to capture early Aβ and tau accumulation.
- Developing sensitive and clinically relevant PET methods for tracking brain deposition of Aβ and tau.
- Investigating individuals with normal CSF marker but abnormal PET markers and vice-versa.
Jump to:
Threshold for early Aβ deposition
Alzheimer’s disease vulnerable brain regions
In a recent study published in Brain [pubmed, PDF] we analyzed PET images from healthy controls and patients, including both imaging and pathological data, and showed that the statistical thresholds that are generally used in the field to assess amyloid (Aβ) positivity are too high to capture individuals with low but still significant Aβ. In this study we also assessed the pattern of Aβ deposition in the brain (see video below). Dr. Villeneuve received the Human Amyloid Imaging Young Investigator Award as recognition for that work. Press recognition: Alzforum
Video: Voxel-wise analyses showing the pattern of Aβ accumulation in older adults. Each image represent a contrast of 22 subjects with a mean global DVR value > 1 to a reference group (N=22) with a global DVR=1. Significant voxels first appeared when the group mean was DVR=1.07. Threshold at p <.05 after FWE correction, k >150.
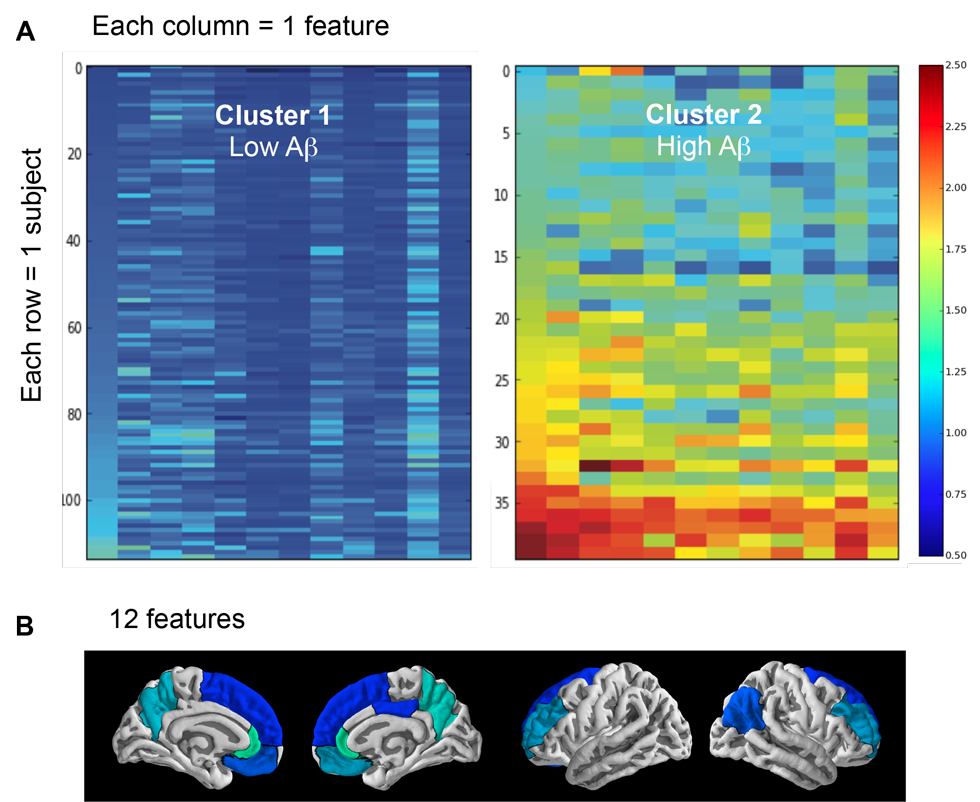
Figure: Cluster analysis containing 2 clusters (groups) representing individuals with low and high Aβ burden (A), as well as the 12 features (brain regions) that helped identify these two clusters (B). Warmer colors are associated with higher distribution volume ratio (DVR) values. For each cluster, each row represents one subject and each column represents one of the 12 features that helped identify the two clusters. From left to right, the 12 features are: rostral anterior cingulate left hemisphere (lh), rostral anterior cingulate right hemisphere (rh), precuneus rh, precuneus lh, medial orbitofrontal rh, rostral middle frontal lh, rostral middle frontal rh, inferior parietal rh, medial orbitofrontal lh, superior orbitofrontal rh, posterior cingulate rh, superior orbitofrontal lh.
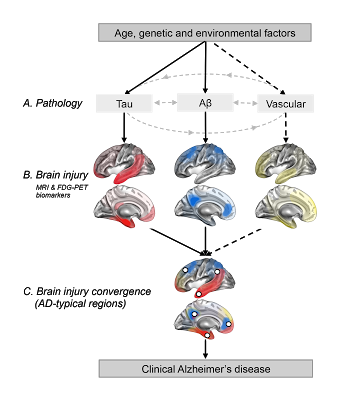
Along with Miranka Wirth and Renaud La Joie we published an opinion paper in Frontiers in Aging Neuroscience [pubmed, PDF]. We discussed the topography of Alzheimer-related brain injury (as observed with MRI or FDG-PET) and proposed that these regions that are highly altered in AD might in fact be the convergence points of multiple pathologies: tau, amyloid, vascular…
Figure: Regional convergence of different pathologies (and their impact) involved in the clinical expression of late-onset Alzheimer’s disease. Solid lines represent pathologies that are needed to develop the clinical onset of Alzheimer’s disease (AD), while the dotted line represent a pathological factor that is not needed but, if present increases the risk of developing AD. The pattern of brain injury associated with tau, Aβ and vascular pathologies is represented by a schematic illustration based on current literature. White dots represent brain regions where at least two pathologies are converging. These white dots also represent brain regions that are typically found to be atrophied and/or hypometabolic in individuals with AD, and when atrophied in cognitively normal older adults they increase the risk of progression to AD.
DISCLAIMER: The documents distributed here have been provided as a means to ensure timely dissemination of scholarly and technical work on a noncommercial basis. Copyright and all rights therein are maintained by the authors or by other copyright holders, notwithstanding that they have offered their works here electronically. It is understood that all persons copying this information will adhere to the terms and constraints invoked by each author’s copyright and or other publishers (as appropriate). These works may not be reposted without the explicit permission of the copyright holder.